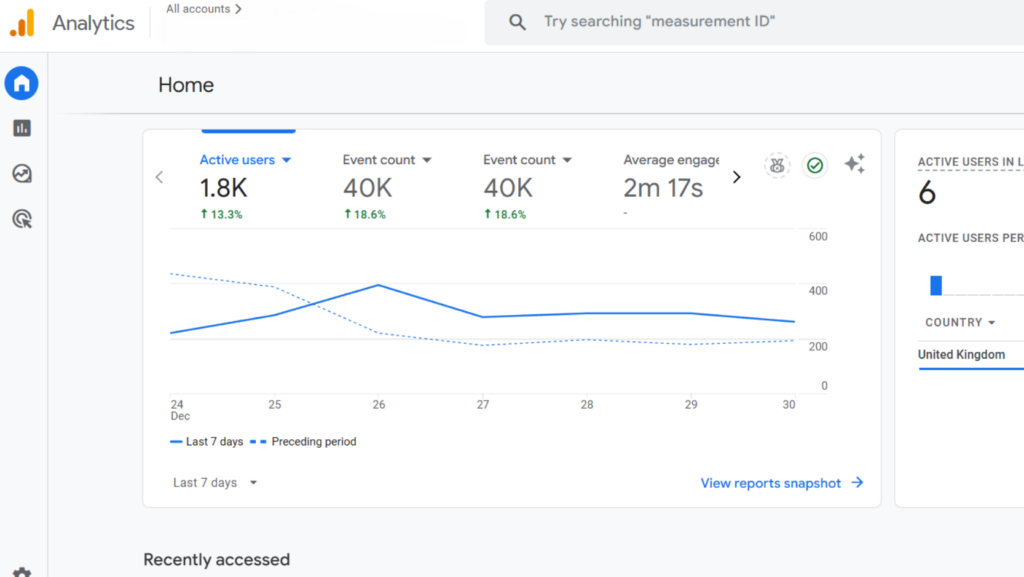
Using a helpful benchmarking tool, Google Analytics allows you to evaluate your website in relation to Google’s performance standards. In the Google Analytics property, you have access to, you can enable and adjust this tool if you are interested in knowing whether your website is above or below the average for benchmarking measures. This feature was first introduced in 2014 by Google to help anyone compare and improve strategies. Consequently, Google Analytics benchmarks by industry are vital for understanding relative performance and refining digital marketing efforts.
Unaware how you can track and compare your performance with Google Analytics Benchmarking Metrics? This blog will help you understand how benchmarking in GA4 can help your business perform better, how to use it, and much more!
Key Takeaways
- GA4 industry benchmark can help you as an essential reference point to know what’s happening with your competitors and how your performance compares
- Aggregate benchmark data only becomes available when minimum thresholds are reached.
- Benchmarks give relevant comparisons based on data from similar companies in your sector.
- Also, daily benchmark data allows you to make daily comparisons of metrics.
What is Benchmarking in Google Analytics?
Benchmarking in Google Analytics is a feature you can use to compare your data with aggregated industry statistics from other businesses who contribute their data. Having this information gives you significant context, which enables you to establish relevant goals, receive insight into trends that are occurring throughout your business, and determine how well you are doing in comparison to your competitors.
Google Analytics Benchmarks by Industry
For companies monitoring their online performance, Google Analytics 4 (GA4) has revolutionized their approach. However, to grasp data, you must know how your measurements stack against industry standards.
For example, while sectors like banking or healthcare could have lower rates owing to more specialized content, businesses like eCommerce frequently have average bounce rates of 40-60%. Comparatively, conversion rates differ significantly; retail sites average about 2.8%, but travel and hospitality hover near 4%.
With added capabilities like cross-device tracking and event-based measurement, GA4 gives these comparisons depth. This lets companies better target marketing, probe user behavior, and increase return on investment. Aligning the performance of your website with GA4 industry benchmarks helps you to find areas for development.
How To Use Google Analytics Benchmarks?
Finding Benchmarking
Sign in to your Google Analytics account and begin at the “Home” page. To find the measuring icon, look in the upper right part of the overview card. It seems like a small medal.
To make sure your Google Analytics property is opted-in for benchmarking the functionality visible in your reports, Navigate to ” Admin” and choose “Account Details,” which is under “Account.” After that, make sure the “Modeling Contributions & Business Insights” option is turned on.

Selecting a Metric
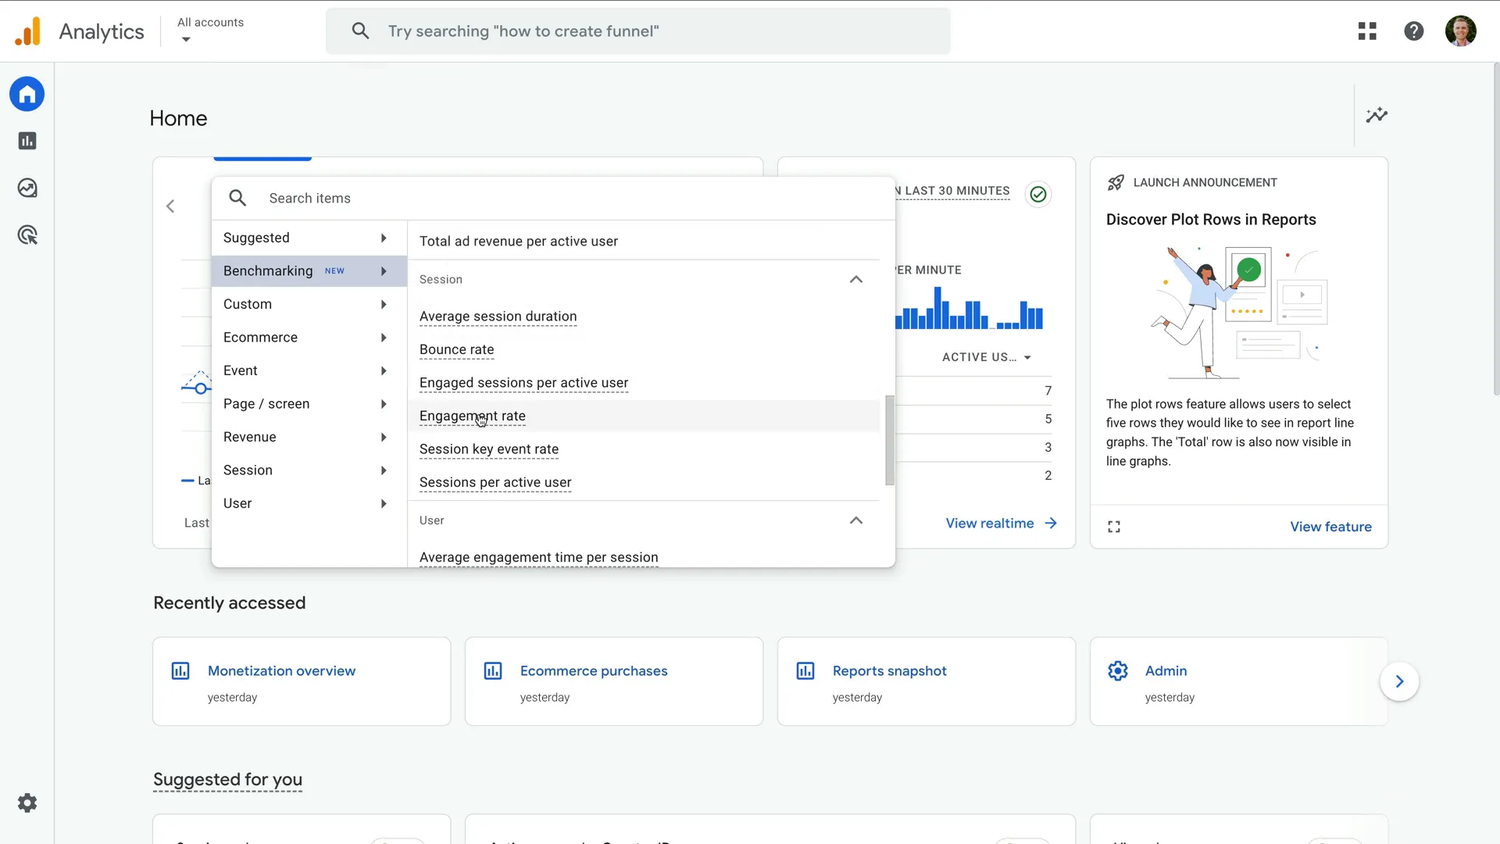
Moreover, you’ll need to add the benchmark measure to the overview card to get the measuring data. To do this, first choose one of the metrics on the card. Then, click “Benchmarking” to see all the available metrics.

Choosing a Benchmark Metric
After selecting a benchmark metric, the chart will display benchmarking data. This shows how your website compares to the benchmark. Over 30 benchmark indicators are accessible in Google Analytics. Highlights include:
- For conversion-focused sites: User and session key event rates
- Users, average revenue, and ARPU for ecommerce websites
- To understand engagement: engagement rate, average session time, new user rate
Understanding Benchmark Data
If you choose the “Engagement Rate” benchmark measure, the chart will show the performance of your website relative to the benchmark. However, if you select the “Engagement Rate” benchmark metric, the chart will illustrate your website’s relative performance to the benchmark.
Changing Peer Groups
Click the benchmarking icon to change the comparison by selecting another peer group. This allows you to evaluate the performance of your website according to several industry verticals. If your website falls into several categories, you might discover that changing peer groups reveals any variations in the benchmark statistic.
Google Analytics Benchmarking Metrics Example
Benchmarking is essential to know your site’s performance when utilizing Google Analytics. For instance, if you manage an eCommerce site, you may compare your average session length or conversion rate with industry averages. Assume your sector’s typical conversion rate is 2%, but you are hitting 3%. That is a favorable sign. Another relevant example is the bounce rate; if the bounce rate of your website is more than 50%, it might indicate problems with interaction.
Conclusion
Google Analytics Benchmarking, especially GA4 industry benchmarks, is an invaluable tool for elevating your digital strategy. Understanding your important KPIs and matching your performance to industry norms can help our SEO service identify areas for development, create reasonable targets, and adjust your website and marketing campaigns. Therefore, get in touch with us today if you want assistance using these insights to increase your online profile!
Frequently Asked Questions (FAQ)
Q.1. What metrics can I benchmark?
A.1. Metrics you can benchmark include:
- New user rate
- Average engagement time per session
- Average engagement time per user
- Event count per user
- Engagement rate
- Bounce rate
- Daily active users / Monthly active users (DAU / MAU)
- Daily active users / Weekly active users (DAU / WAU)
- Weekly active users / Monthly active users (WAU / MAU)
- Average revenue per user (ARPU)
- Average revenue per paying user (ARPPU)
- First-time purchaser rate (FTP rate)
- Sessions per user
- Active users
- Pageviews
- Conversions
- Add to carts per user
- Checkouts per user
- Total ad revenue per user
- Transactions per purchaser, and
- Transactions per user
Q.2. How does Google benchmark work?
A.2. Google Benchmark compares your website’s performance with those of similar companies. Therefore, you can easily monitor site performance, user experience, and mobile friendliness, etc., thereby enabling companies to know the areas that require work.
Q.3. What is the most important metric in Google Analytics?
A.3. Among the most fundamental yet crucial measurements available in Google Analytics 4 would be “The Users metric.” It counts the distinct visitors your website attracted during a designated period.
Q.4. What is a good engagement rate in Google Analytics 4?
A.4. Google Analytics 4 defines a healthy engagement rate of about 50–60% among all firms. According to LinkedIn Ads benchmark statistics, businesses view a decent monthly engagement rate of about 600.
Also Read:
YouTube Keyword Research in 2025: Everything You Need to Know
Search Google Or Type URL: Step-by-Step-Guide 2025
Google Rolls Out December Spam Update 2024
Top 5 On-Page SEO Techniques for 2025

Sarabjeet Singh is the Vice President of Operations at Tech2Globe and brings over 15 years of experience in various industries, including IoT, education, retail, government, FMCG, hospitality, and e-commerce. His leadership focuses on operational excellence and exceeding customer expectations, implementing contemporary solutions. Sarabjeet’s expertise spans e-commerce consulting, software development, data management, BPO/KPO support services, digital marketing, graphics, and startup consulting. He fosters a collaborative work environment, ensuring Tech2Globe delivers high-quality solutions.


