


Summary: The results are more effective when you share and explain the data to your clients through Google Analytics reports. This blog will help you learn what it takes to build a GA4 report and how to save and share it correctly. Also, remember to explore the FAQs section at the end, where we have answered questions related to analytics reports.
Google Analytics is a service developed by Google in 2005, thanks to the efforts of Urchin Software Corporation and Paul Muret, a crucial programmer. As we all know, the Google team is always working on improvements. For instance, GA4 in 2020 came with new features, integrated features, and measures to protect users’ privacy.
Consequently, when it comes to preparing the digital marketing report, the integration of Google Analytics is essential, as it covers everything and makes the DM report more comprehensive. And, being the leading agency, we understand the effort that goes into creating a perfect report that includes all key metrics and presents data to clients clearly, without confusion. Therefore, we cover all the report types in GA4, how to build one, and showcase it to your partners, including the purpose, to make it easier for you.
What is the Purpose of Google Analytics Reports?
The main reason for having Google Analytics reports is that it is convenient to have all the information in one place. Prominent organizations like Amazon, NASA, and Epson (a leading electronics company) rely on Google Analytics, are among the firms that use Google Analytics due to their aptitude for providing reports on key performance indicators.
- A helpful tool for all types of businesses: Whether your main aim is lead generation or e-commerce success, Google Analytics reports satisfy various objectives. Reports may be prepared especially around them and offer industry standards depending on the industry category you pick for building a GA4 property.
- Gives clear ideas for future decisions: With GA4’s new capabilities, such as privacy tracking and cookieless tracking, modern marketers will have an analytics platform that fits the future.
- Best way to show clients what’s working: You can share the results with your clients by customizing them accordingly, ensuring there’s no risk if the outcomes are not as expected. However, if there’s still a discrepancy, discuss the issues openly and explain the reasons.
How to Create Google Analytics GA4 Report for Clients?
Building a comprehensive digital marketing report requires Google Analytics GA4, customized to meet client requirements and align with their objectives. Follow the steps below, along with the accompanying image, to create one easily.
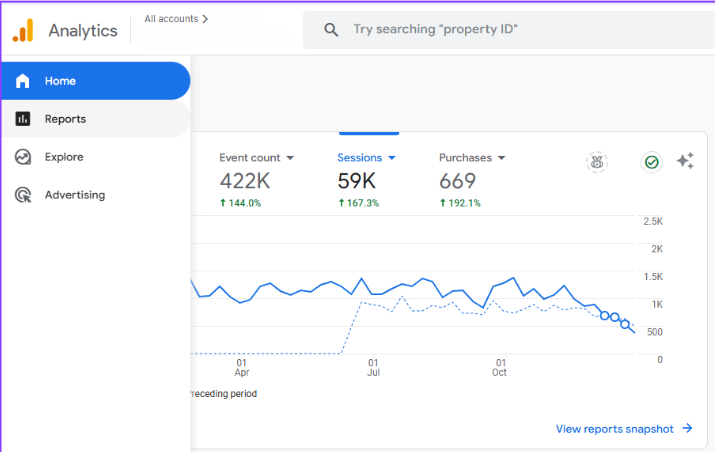
Step 1: Access the Report Builder
To begin creating a report in GA4, select the Reports section. From there, select Library at the bottom of the left navigation panel (note: this requires an Editor role). Once in the Library, scroll down to the Reports table. You can either click + Create new report and choose Create overview report or hover over an existing overview report and select Edit or Make a copy to customize it further.

Step 2: Select a Base Report
After that, choose one of the reports which have the “Overview report” category in the table. Also if you attempt to create a new Analytics Google report, always make sure to define the purpose of the report and the audience that it is going to serve.
Step 3: Customize Report Contents
To open the Report Builder, use the Cards section to add, rearrange, or remove summary cards. You can drag cards to adjust their order, click the “x” to delete cards, or use + Add Cards to include new summary cards from detail reports. Secondly, change general settings of the Report Template to address the client’s needs by linking or unlinking reports as necessary. Make sure the design and structure are relevant to the client’s goals and that the scientific and technical brief offers the client an appropriately targeted summary.
Step 4: Set as Reports Snapshot (Optional)
To make the report the default Reports snapshot, open the report in the Library navigation and choose Set as Reports snapshot from the menu. This will make the selected report the home view, which means it will be the first thing you see when you log in to your Google Analytics account.
Step 5: Linking and Unlinking Reports
The linked reports get the update from Google by default. However, if you wish to handle these updates individually, you can click on ‘Unlink’ placed right beside the name of the template. Remember that this is a one-way process and linking is only possible prior to the reports being saved, after which unlinked reports will be standalone and will need to be updated manually thereafter.
Step 6: Preview and Save
Once done, click on Save to effect the changes you have made. You should look at the alert that seems to indicate that changes made have been applied to the right collections successfully.

Step 7: Share the Report and Request Feedback
Now, you just need to share the Google report (GA4 report) with the client. Make sure to include a brief explanation of what it is about, specifying the month, data, or year covered. It’s best to schedule a virtual or in-person meeting (if possible). Give them some time to review it and ask for their thoughts, genuinely listening to their concerns (if any).

Why Does GA4 Fall Short for Customised Reporting Needs?
Reasons why the GA4 report may not be ideal is because of these minor limitations:
Limited Customization: One of the most significant disadvantages of GA4 dashboards is that you cannot add guiding elements such as texts, comments, or annotations to explain certain KPIs or figures to clients and their businesses.
No Color Options: One functionality missing in GA4 that is quite valuable for earlier versions of GA is the inability to add colors to figures.
Lack of Branding: Another disadvantage of GA4 is that it does not let users add logos or brand colors, which makes reports’ appearances inconsistent.
Design Restrictions: Nevertheless, what is clear is that design elements can become necessary if the reports are used in large organizations or for specific products.
Challenges with Public Sharing: When reports are shared publicly, GA4’s lack of customization features can hinder effective communication and the professional presentation of data.
What are the Types of Google Analytics 4 Reports?
The Google Analytics 4 reports are mainly categorized into 2 types: Standard Reports and Explorations.
1. Standard Reports
In Google Analytics GA4, developing a standard report is quite easy to do. This report is located under the ‘Home’ tab on the left menu bar where all available reports are compiled under the ‘Reports’ tab. Check the image below for guidance:
When clicking on it, you get different types of reports, such as Report Snapshot, Acquisition, Engagement, User, and many more. All these categories offer basic and easy solutions to create simple reports and share them.
The subcategories presented under the Lifecycle and User sections have specific roles and functions. For example, Acquisition shows how users got to your website, and for this reason, it’s perfect for evaluating marketing operations. At the same time, the User collection is more about identifying particular users and detailing their behaviors and characteristics if you need to better understand your audience.
2. Explorations
Unlike standard reports, which give an average understanding of your data, “Explorations” are meant for richer analysis. They provide more sophisticated approaches to learning more about users’ behavior and characteristics to be used in creating special reports. The image below highlights where “Exploration” is located in the left sidebar. To do a new search, click on the Blank card with the plus sign + or choose one of the templates in the gallery.

Explorations provide several methods for analysing data:
- Free-form Exploration: Organize your information in any way you like.
- Cohort Exploration: Study groups of users over time.
- Funnel Exploration: Determine where people get lost in a process.
- Segment Overlap: Show the same user segment or a different one and how.
- User Exploration: Focus on individual user journeys.
- Path Exploration: Visualize the steps users take across your site or app.
- User Lifetime: Examine long-term user behavior and value.
How to Showcase Your Google Analytics Findings?
It won’t be wrong to accept that each client is different from the other and has different objectives and aims. However, it focuses on one central principle of performing the deal – the aspect of results. Ensure that when presenting your reports, you choose an understanding, assertive demeanor that will be easily relatable to them. In addition, we would like to mention that some clients may not be aware of GA4 due to its relative complexity and several novelties.
If that seems cumbersome, use Looker Studio to simplify your work. You can swiftly import your data with ease. Customisable widgets and configurable tooltips help you build KPI reports and gradually explain metrics to your clients.

Once you’ve completed your analysis, you can export the findings in several formats:
- Google Sheets
- TSV (Tab Separated Values)
- CSV (Comma Separated Values)
- PDF (all tabs)
Here’s how you can share access of a GA4 Report:
- Firstly, select Admin from the Google Analytics page.
- Choose the account and select “Account Access Management.”
- Enter the email address of the individual you wish to share access with.
- Select the user’s role.
- Ask the recipient to approve the request after clicking Add.
How We Can Help Crafting Customized Google Analytics Reports?
Of course, generating qualitative Google Analytics reports for clients could be demanding because of procedural complications such as tool constraints and data inconsistency. That is where our professional digital marketers come in to offer their assistance. They are familiar with all the intricacies of creating detailed Google Analytics reports and are up to speed with GA4. Therefore, we can provide a specialized report service and industry expertise that can result in accurate information. Contact us for additional info and to discuss the extra services we can offer you.
Also Read:
Google Analytics Benchmarking Metrics
How SEO Agencies Can Deliver Value to Enterprise Clients?
How to Build Your Social Media Marketing Strategy?
Frequently Asked Questions: FAQs
Q.1. What is a Google Analytics report?
A.1. A Google Analytics report is a documented file providing information about the website performance, how the visitors interact with the site and their source. It is useful for businesses to analyze data and monitor their goals and objectives. Additionally, it helps enhance their visibility across the internet and improve user engagement.
Q.2. What are the 6 basic reports of Google Analytics?
A.2. The basic reports of Google reports Analytics are:
- Audience – Concerns about the information of the people visiting your site, including their age, gender, interests, location, and device type.
- Landing page – One of the screens features your refined pages using sessions, engagement, goals, or revenues.
- Mobile overview – It analyzes data comparing bounce rate, page/session, and average session duration for tablets, desktops, and mobile devices.
- Acquisition – The All Campaigns report helps compare the efficiency of advertising campaigns marked with UTM tags.
- Traffic acquisition – Concerned with the origins of users and the way they engage with your site or application.
- User Acquisition – Cater to first-time users and ask them how they learned about your site or application.
Q.3. How to build a report in Google Analytics?
A.3. By following simple and easy steps, such as accessing the library, selecting templates, customizing metrics, using filters and dimensions, and ultimately saving after previewing the report, you can share it with the stakeholders you want.
Q.4. How do I extract a report from Google Analytics?
A.4. To extract or download the Google Analytics report you want, go to the “Reports” section and select the desired “Report.” Then, customize the reports and click the Share button. Then, choose the download option.

Sarabjeet Singh is the Vice President of Operations at Tech2Globe and brings over 15 years of experience in various industries, including IoT, education, retail, government, FMCG, hospitality, and e-commerce. His leadership focuses on operational excellence and exceeding customer expectations, implementing contemporary solutions. Sarabjeet’s expertise spans e-commerce consulting, software development, data management, BPO/KPO support services, digital marketing, graphics, and startup consulting. He fosters a collaborative work environment, ensuring Tech2Globe delivers high-quality solutions.


 and How to Create a Report On It?")

